How to Get an Overview of Your Database and Understand Data Flows

If you're spending more time investigating your data than actually using it, you are in the right place to get to know how to change it. Whether you're in finance, analytics, or IT, you're likely dealing with the same invisible problem: a lack of visibility into how your data flows and transforms.
Where does this number come from? Why is my report showing different results than last month? How can I trace data back to its source?
Have you asked any of these questions…? Many teams struggle to understand how data flows across systems, why key figures suddenly change, or how to identify the root cause of data errors. Whether you're in finance, analytics, compliance, or IT, the challenge is the same: you need to trust your data, but you can’t, because you don’t know how it got there.
Maybe you’ve tried to track down a broken dashboard or spent hours asking different departments, “Who owns this data?” Or perhaps you've been stuck in a loop of comparing metrics across systems, wondering, “Why are my KPIs inconsistent?” You might even be preparing for an audit, looking for a way to prove where data came from and what transformations it went through.
What you’re really searching for, without knowing it yet, is something called data lineage.
In this article, we’ll explain what data lineage is, why it solves problems like:
- “How to trace data sources in reports”
- “How to find the cause of incorrect data”
- “How to get an overview of data flows in my database”
- “How to document what happens to data from source to dashboard”
- “What changes impact this data field?” … and how it can save you time, reduce risk, and bring clarity to your data landscape.
What is data lineage (in simple terms)?
Think of data lineage like a map that shows the full journey of your data - from where it started, through every transformation and system it passed, all the way to where it ends up, like a dashboard or report.
Let’s say you're looking at a sales number in a monthly report. With data lineage, you can see:
- Where that number came from (e.g., a sales table in your database)
- What calculations or changes were made along the way (e.g., currency conversion, filtering canceled orders)
- Which systems or tools it passed through (e.g., ETL tools, Excel, BI platforms)
In other words, data lineage shows you how data moves and changes, step by step. It’s not just about where the data is stored, but about understanding the full story behind every number you see.
Real-life examples of when you need it
1. “Why are my KPI numbers different in two reports?”
You’re comparing two dashboards, and your revenue metric doesn’t match. Without data lineage, you're guessing. With lineage, you can trace both numbers back to their sources and see exactly where the difference comes from - maybe one report includes discounts, the other doesn’t.
2. “Something broke after a change, how do I know what it affected?”
A developer changed a column name or moved a table. Now reports are failing. With data lineage, you can see which reports, dashboards, or systems use that field, and fix issues faster.
It takes forever to trace where something went wrong.
There’s no documentation of what depends on what.
3. “I need to prove to auditors where this data came from.”
If you're in finance or compliance, you’re often asked for a data trail. Lineage provides an audit-ready view of data transformations and source systems, helping you build trust and pass audits smoothly.
4. “Who is responsible for this data field?”
If you're trying to figure out who owns or manages a specific metric or dataset, lineage helps identify data owners and dependencies, so you stop wasting time emailing 5 different teams.
5. “We want to improve data quality, but don’t know where to start.”
Poor-quality data often comes from upstream problems. With data lineage, you can spot where things go wrong (like missing values, incorrect joins, or outdated sources) making it easier to perform root cause analysis and fix the problem at its source instead of just cleaning up the output.
What are the key capabilities you will appreciate when working with data lineage?
Once you realize you need data lineage, the next question is: What should a good lineage tool actually do? It’s not enough to draw static diagrams or technical flows. The best tools help you understand, interact with, and act on your data. Here are key features you’ll appreciate:
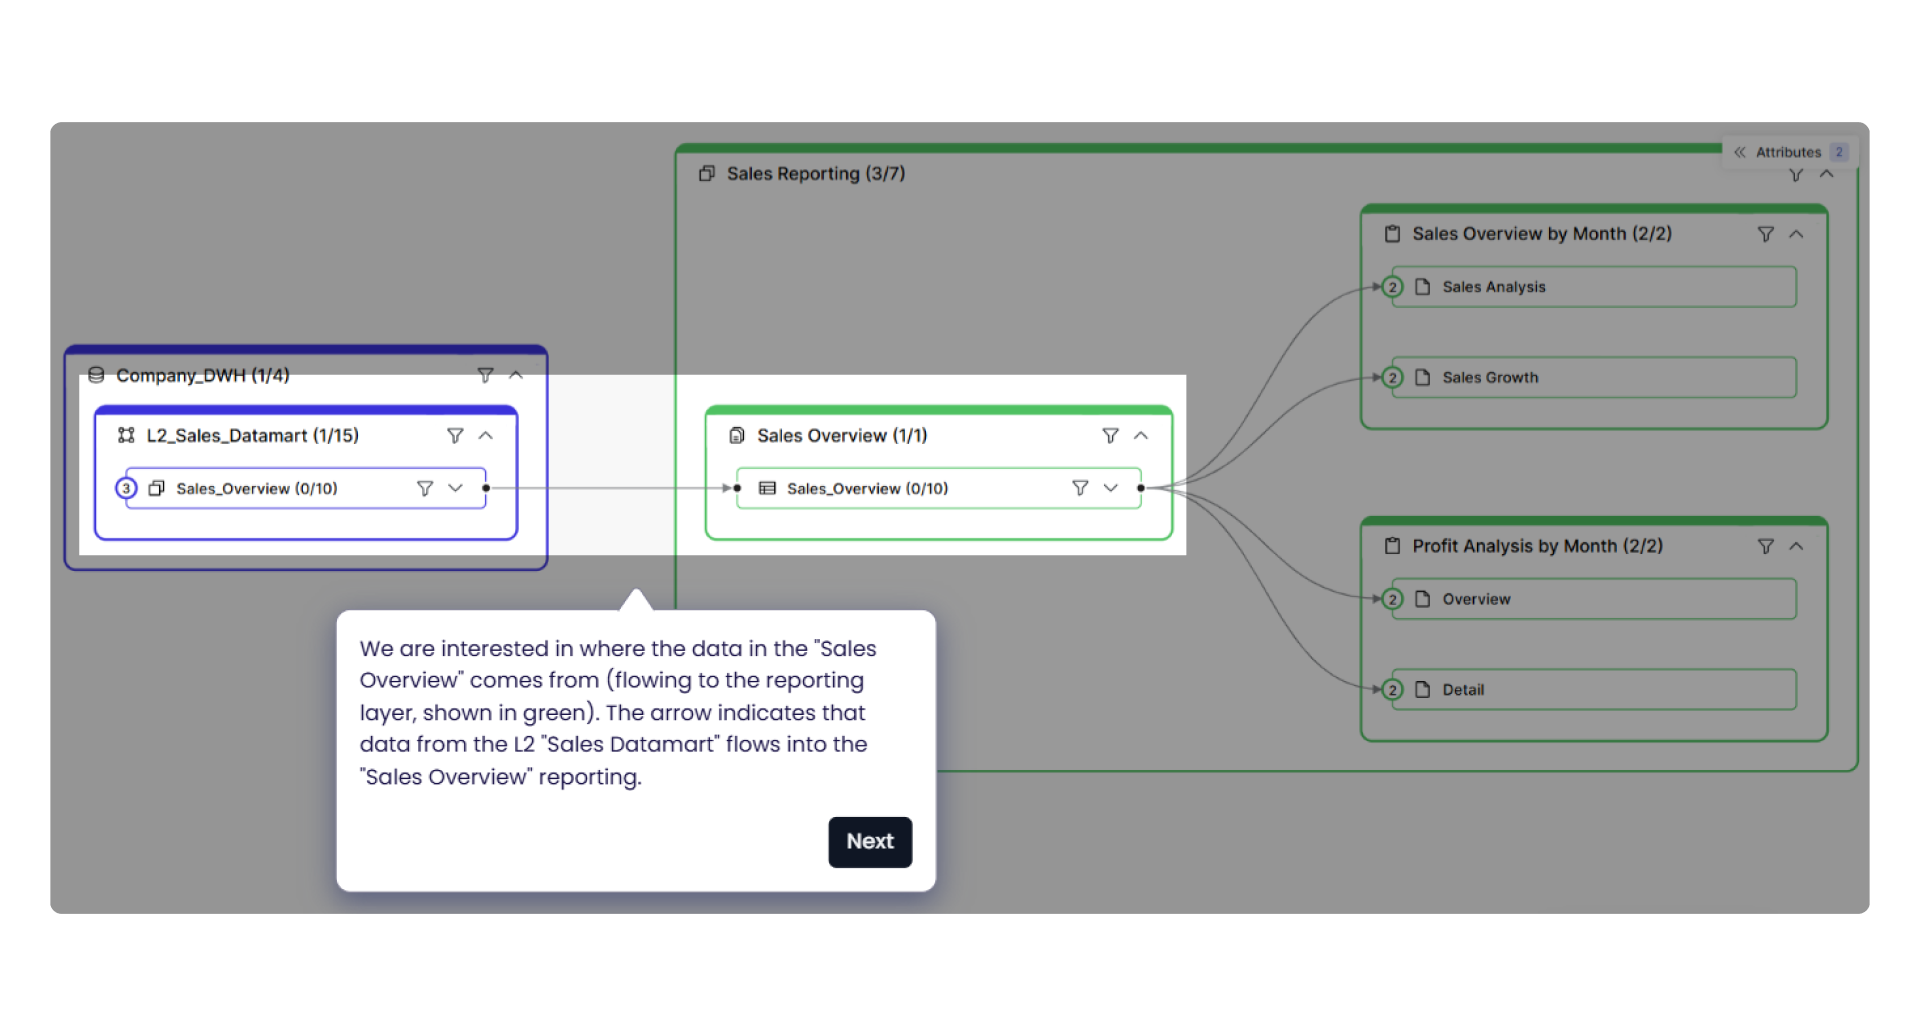
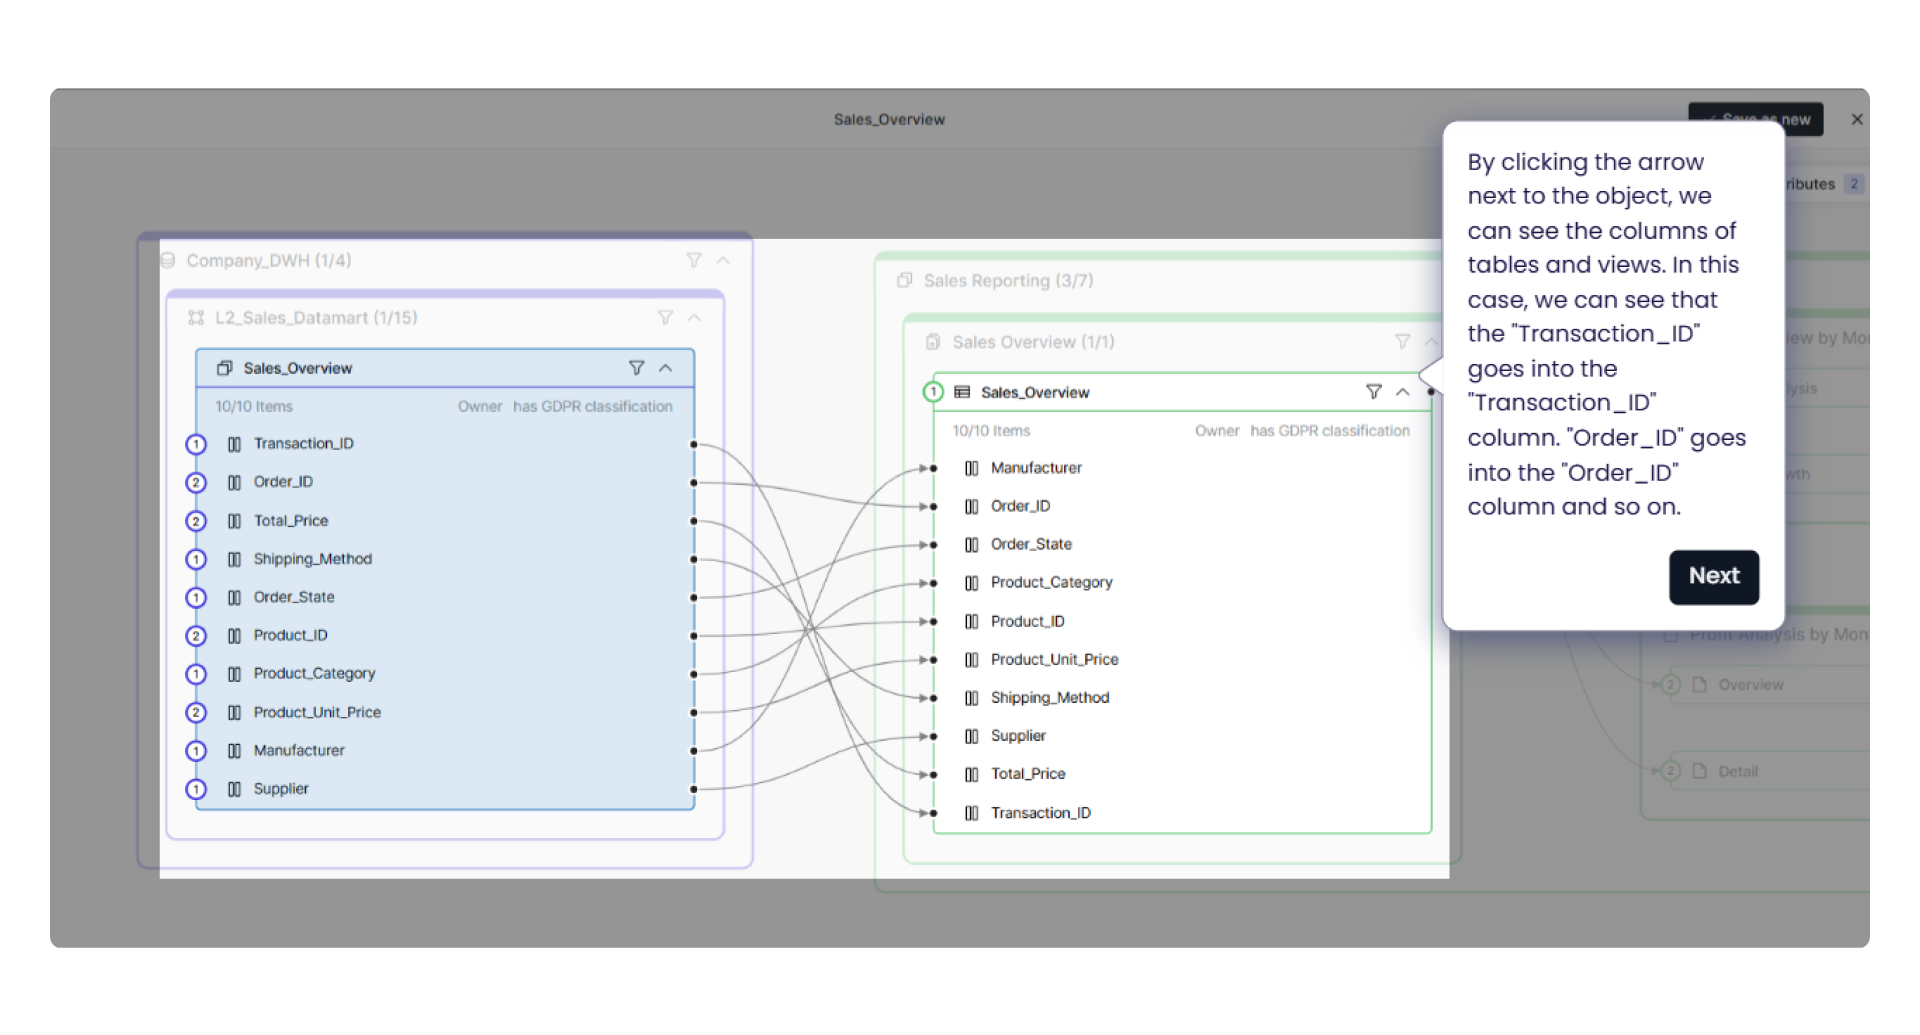
A) Interactive data lineage
You shouldn't need to scroll through PDFs or click through disconnected reports to understand your data. With interactive data lineage, you can explore data flows step by step—zoom in on specific tables, filter by data objects, and instantly see how systems are connected. It turns your complex data environment into something you can visually navigate and understand.
B) Editable and customizable views
Your team may use different terms, need different perspectives, or want to highlight only part of the flow. A good lineage tool should let you adjust and annotate the diagram—whether it's renaming nodes, adding descriptions, or modifying relationships. This helps you keep documentation alive and business-relevant, not just a static IT artifact.
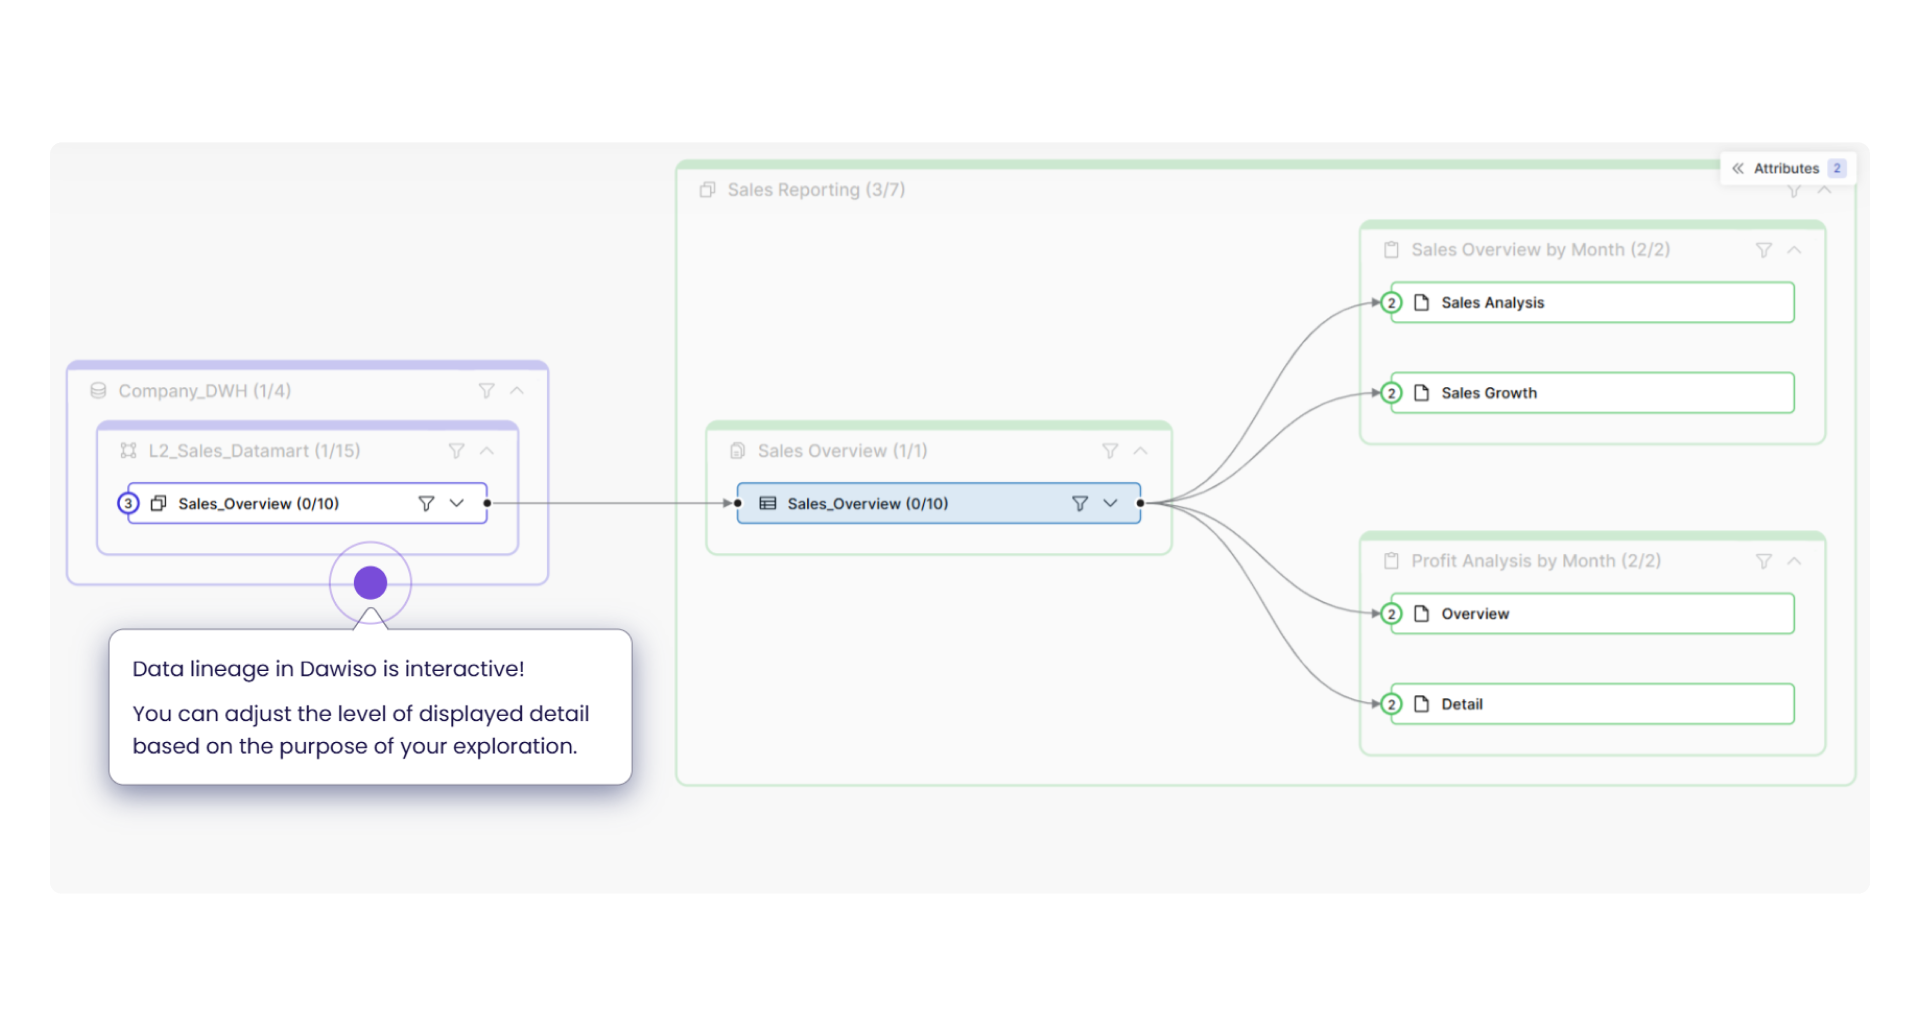
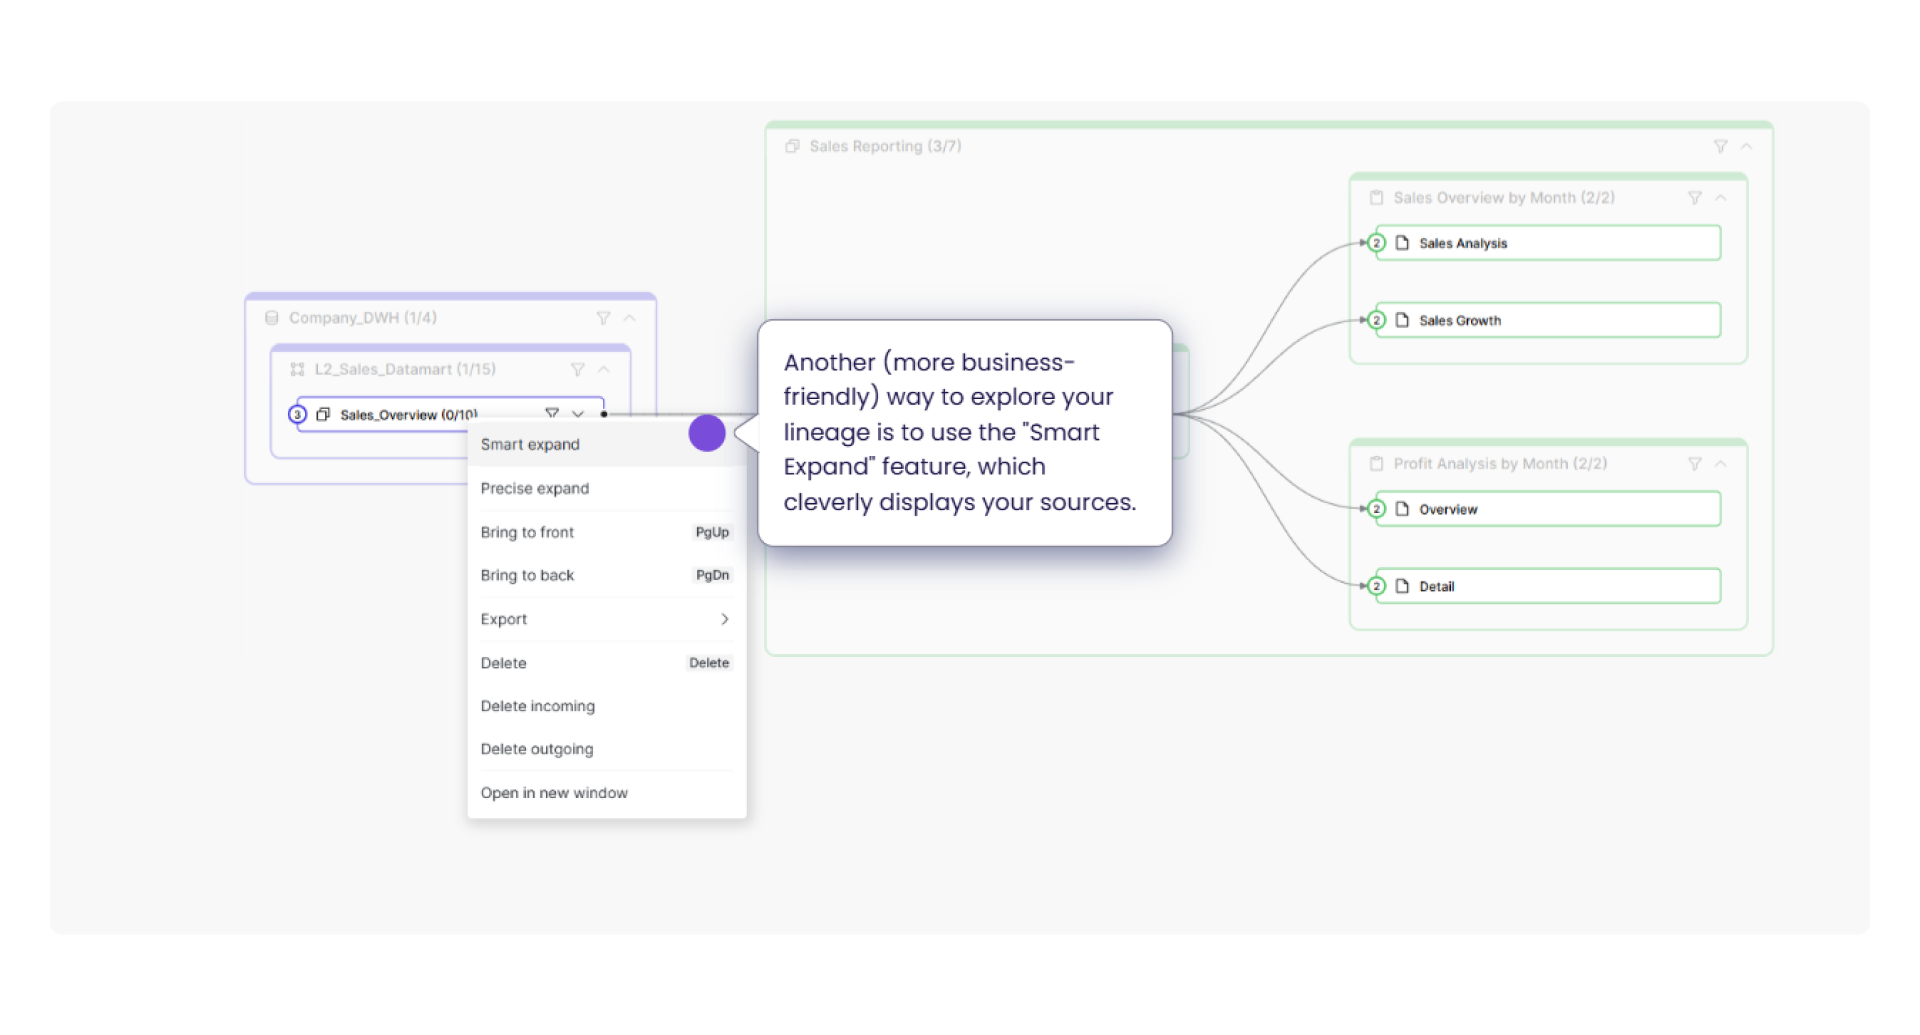
C) Smart Expand
Instead of manually following each link in your data flow, Smart Expand lets you quickly reveal related sources or targets (either incoming, outgoing, or both) based on your chosen level of detail.
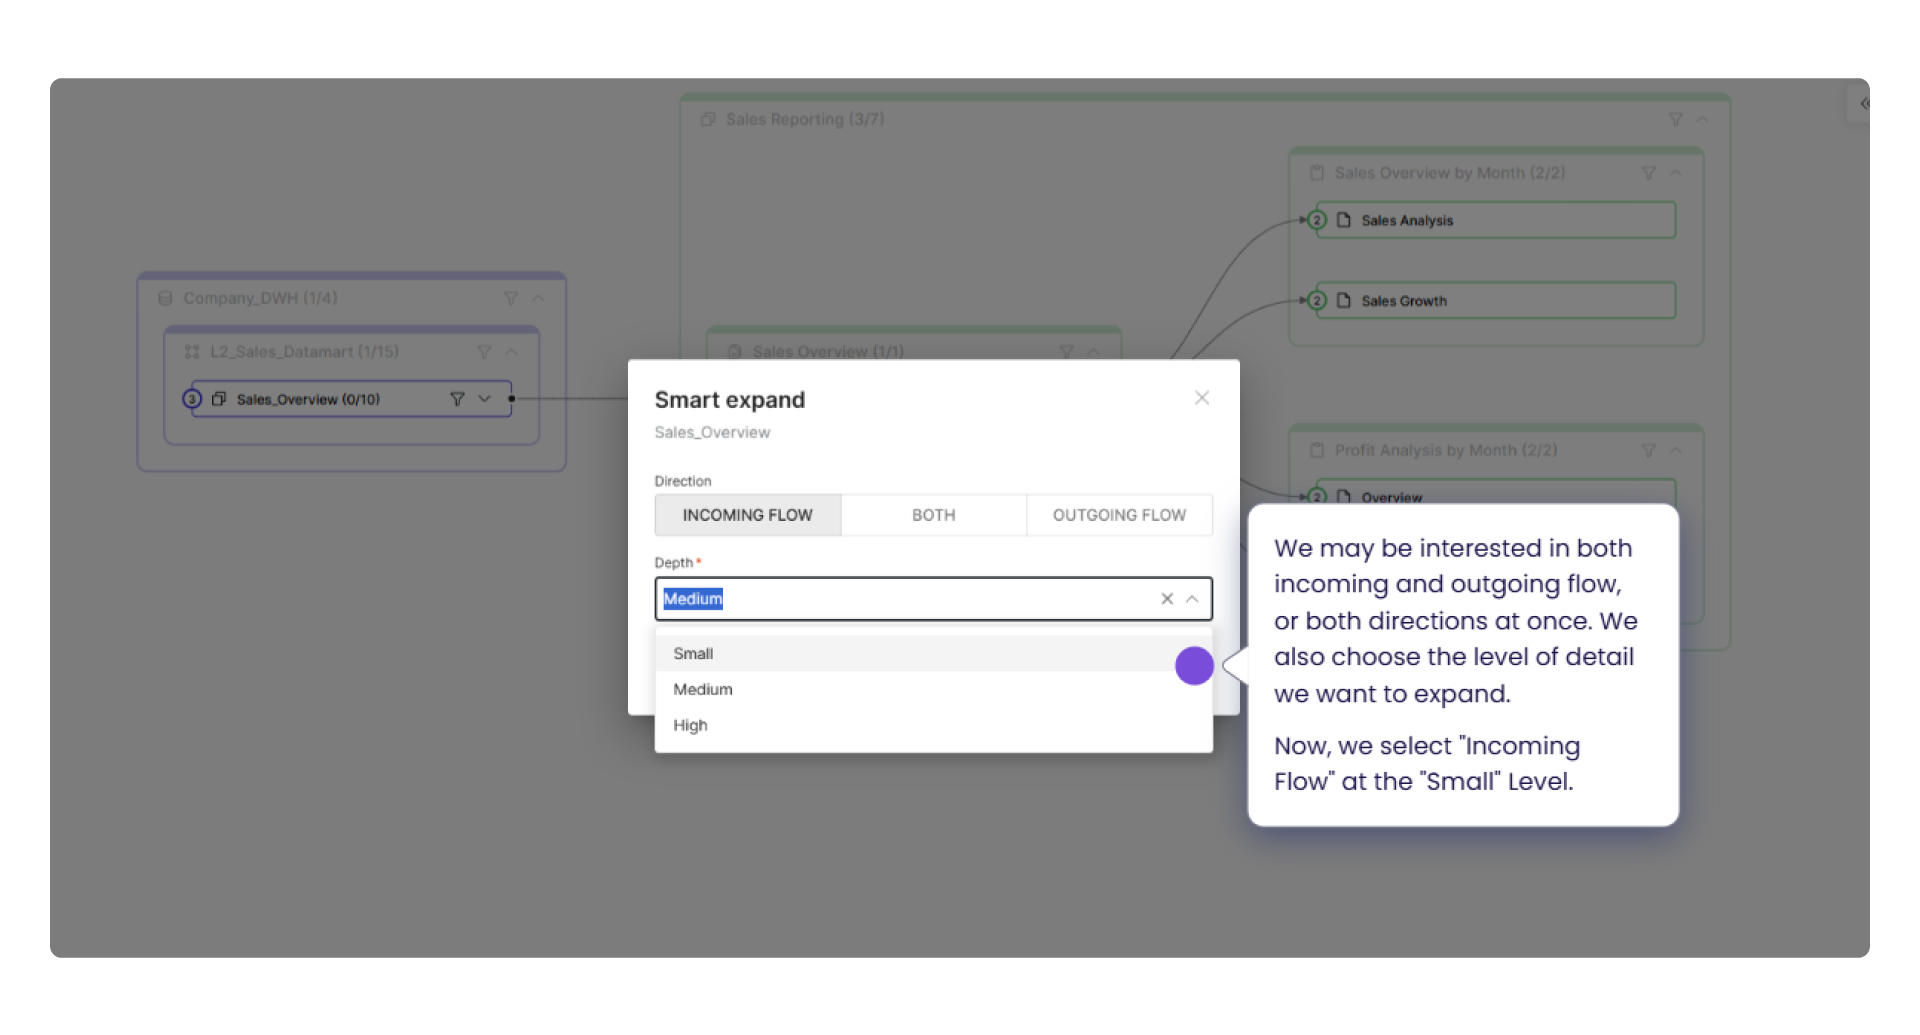
As shown in the example above, this feature gives you:
- Control over direction: Choose whether you want to expand upstream (where the data comes from), downstream (where the data is used), or both at once.
- Control over depth: Pick how many steps or layers you want to explore (e.g., just the immediate source, or a full chain of dependencies).
It’s especially helpful for:
- Business users who want to understand high-level flows without getting overwhelmed.
- Analysts and data owners performing quick impact analysis or trying to find the root of a reporting issue.
- Auditors or compliance checks where you need to show only relevant pieces of the data journey.
D) Automated mapping
Manually documenting data flows takes too long and becomes outdated fast. Tools with automated lineage mapping connect directly to your systems, read metadata, and generate diagrams based on real structures. That means less manual work for you, and more accurate documentation you can trust.
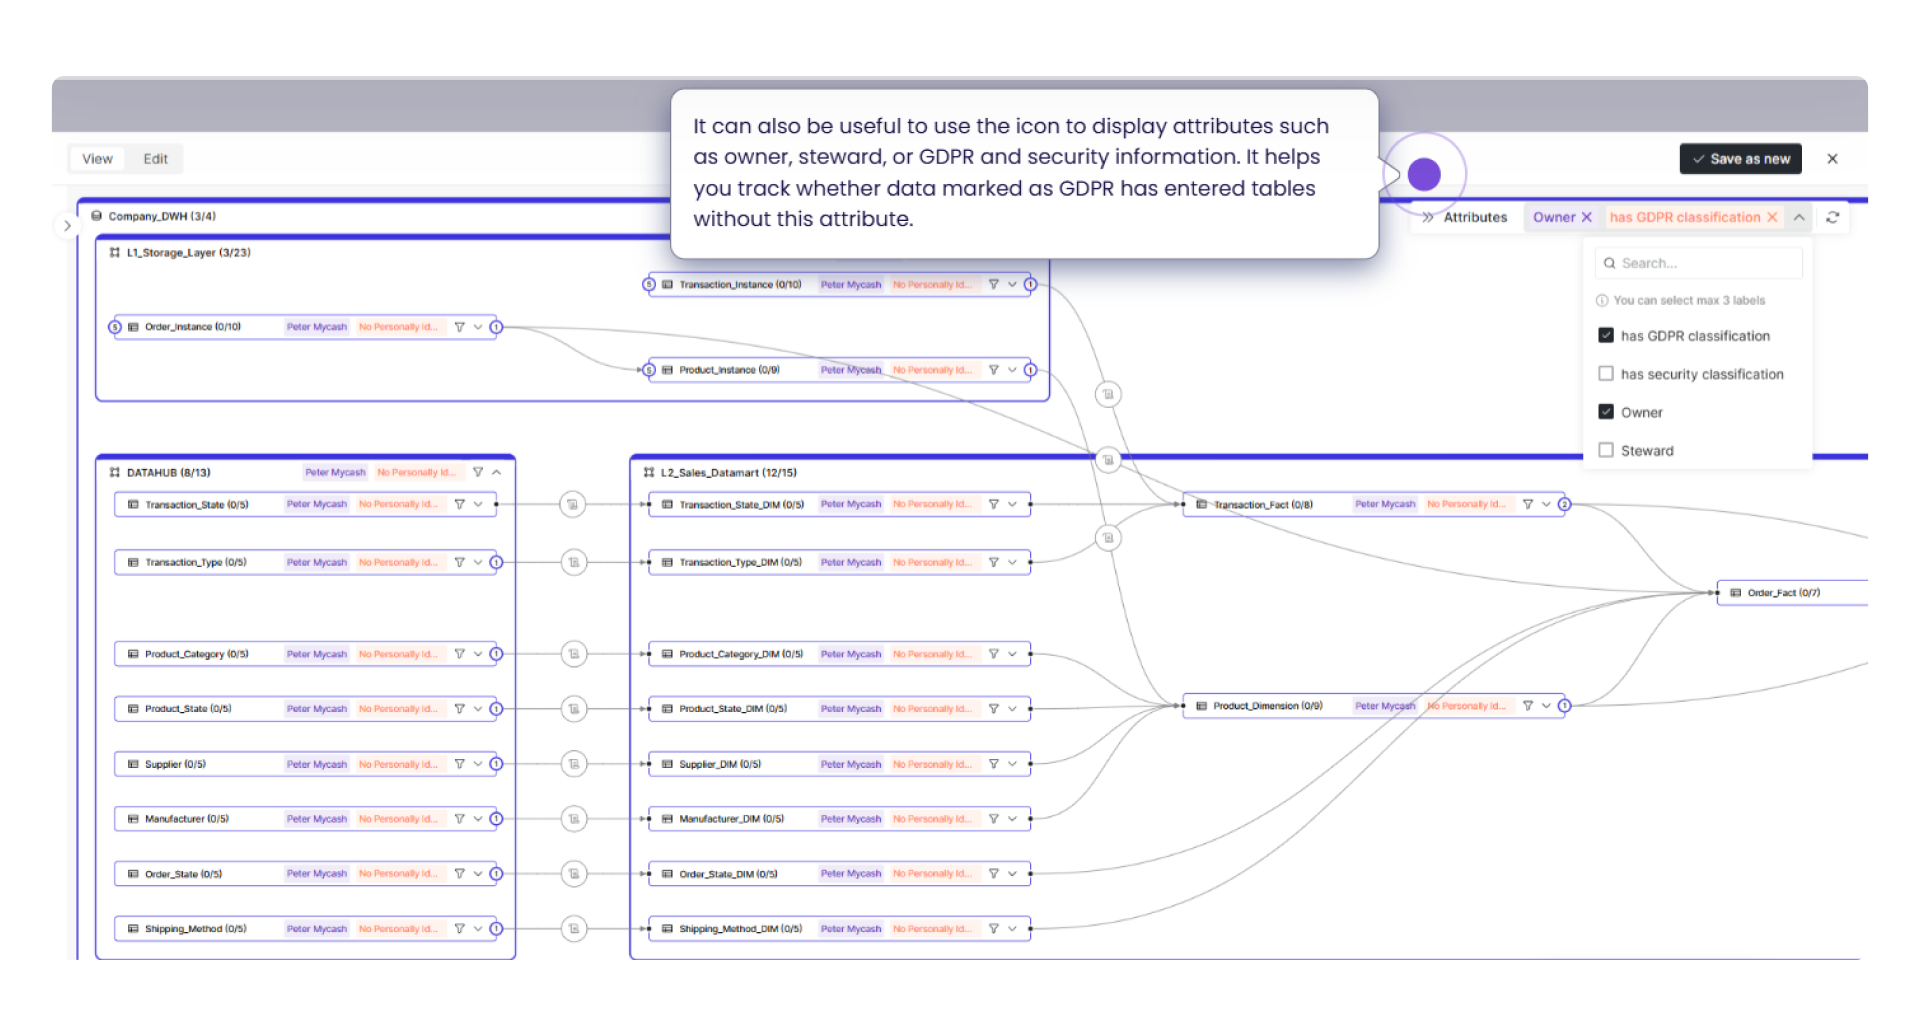
E) GDPR and sensitive data tags
If you're managing personal or regulated data, it's crucial to know where sensitive data appears and how it flows. Good lineage tools allow you to tag and track GDPR-relevant fields, so you can answer questions like: Where is personal data stored? Which reports include customer names or IDs? What happens to that data downstream?
F) Export as a PDF
Sometimes you need to present data lineage to stakeholders, auditors, or colleagues without access to your platform. The ability to export a clear PDF of the lineage diagram makes it easy to include in presentations, documentation, or compliance reports without losing context or clarity.
With interactive, editable diagrams, automated mapping, and features for root cause analysis and compliance, modern data lineage tools help you regain control and confidence in your data.
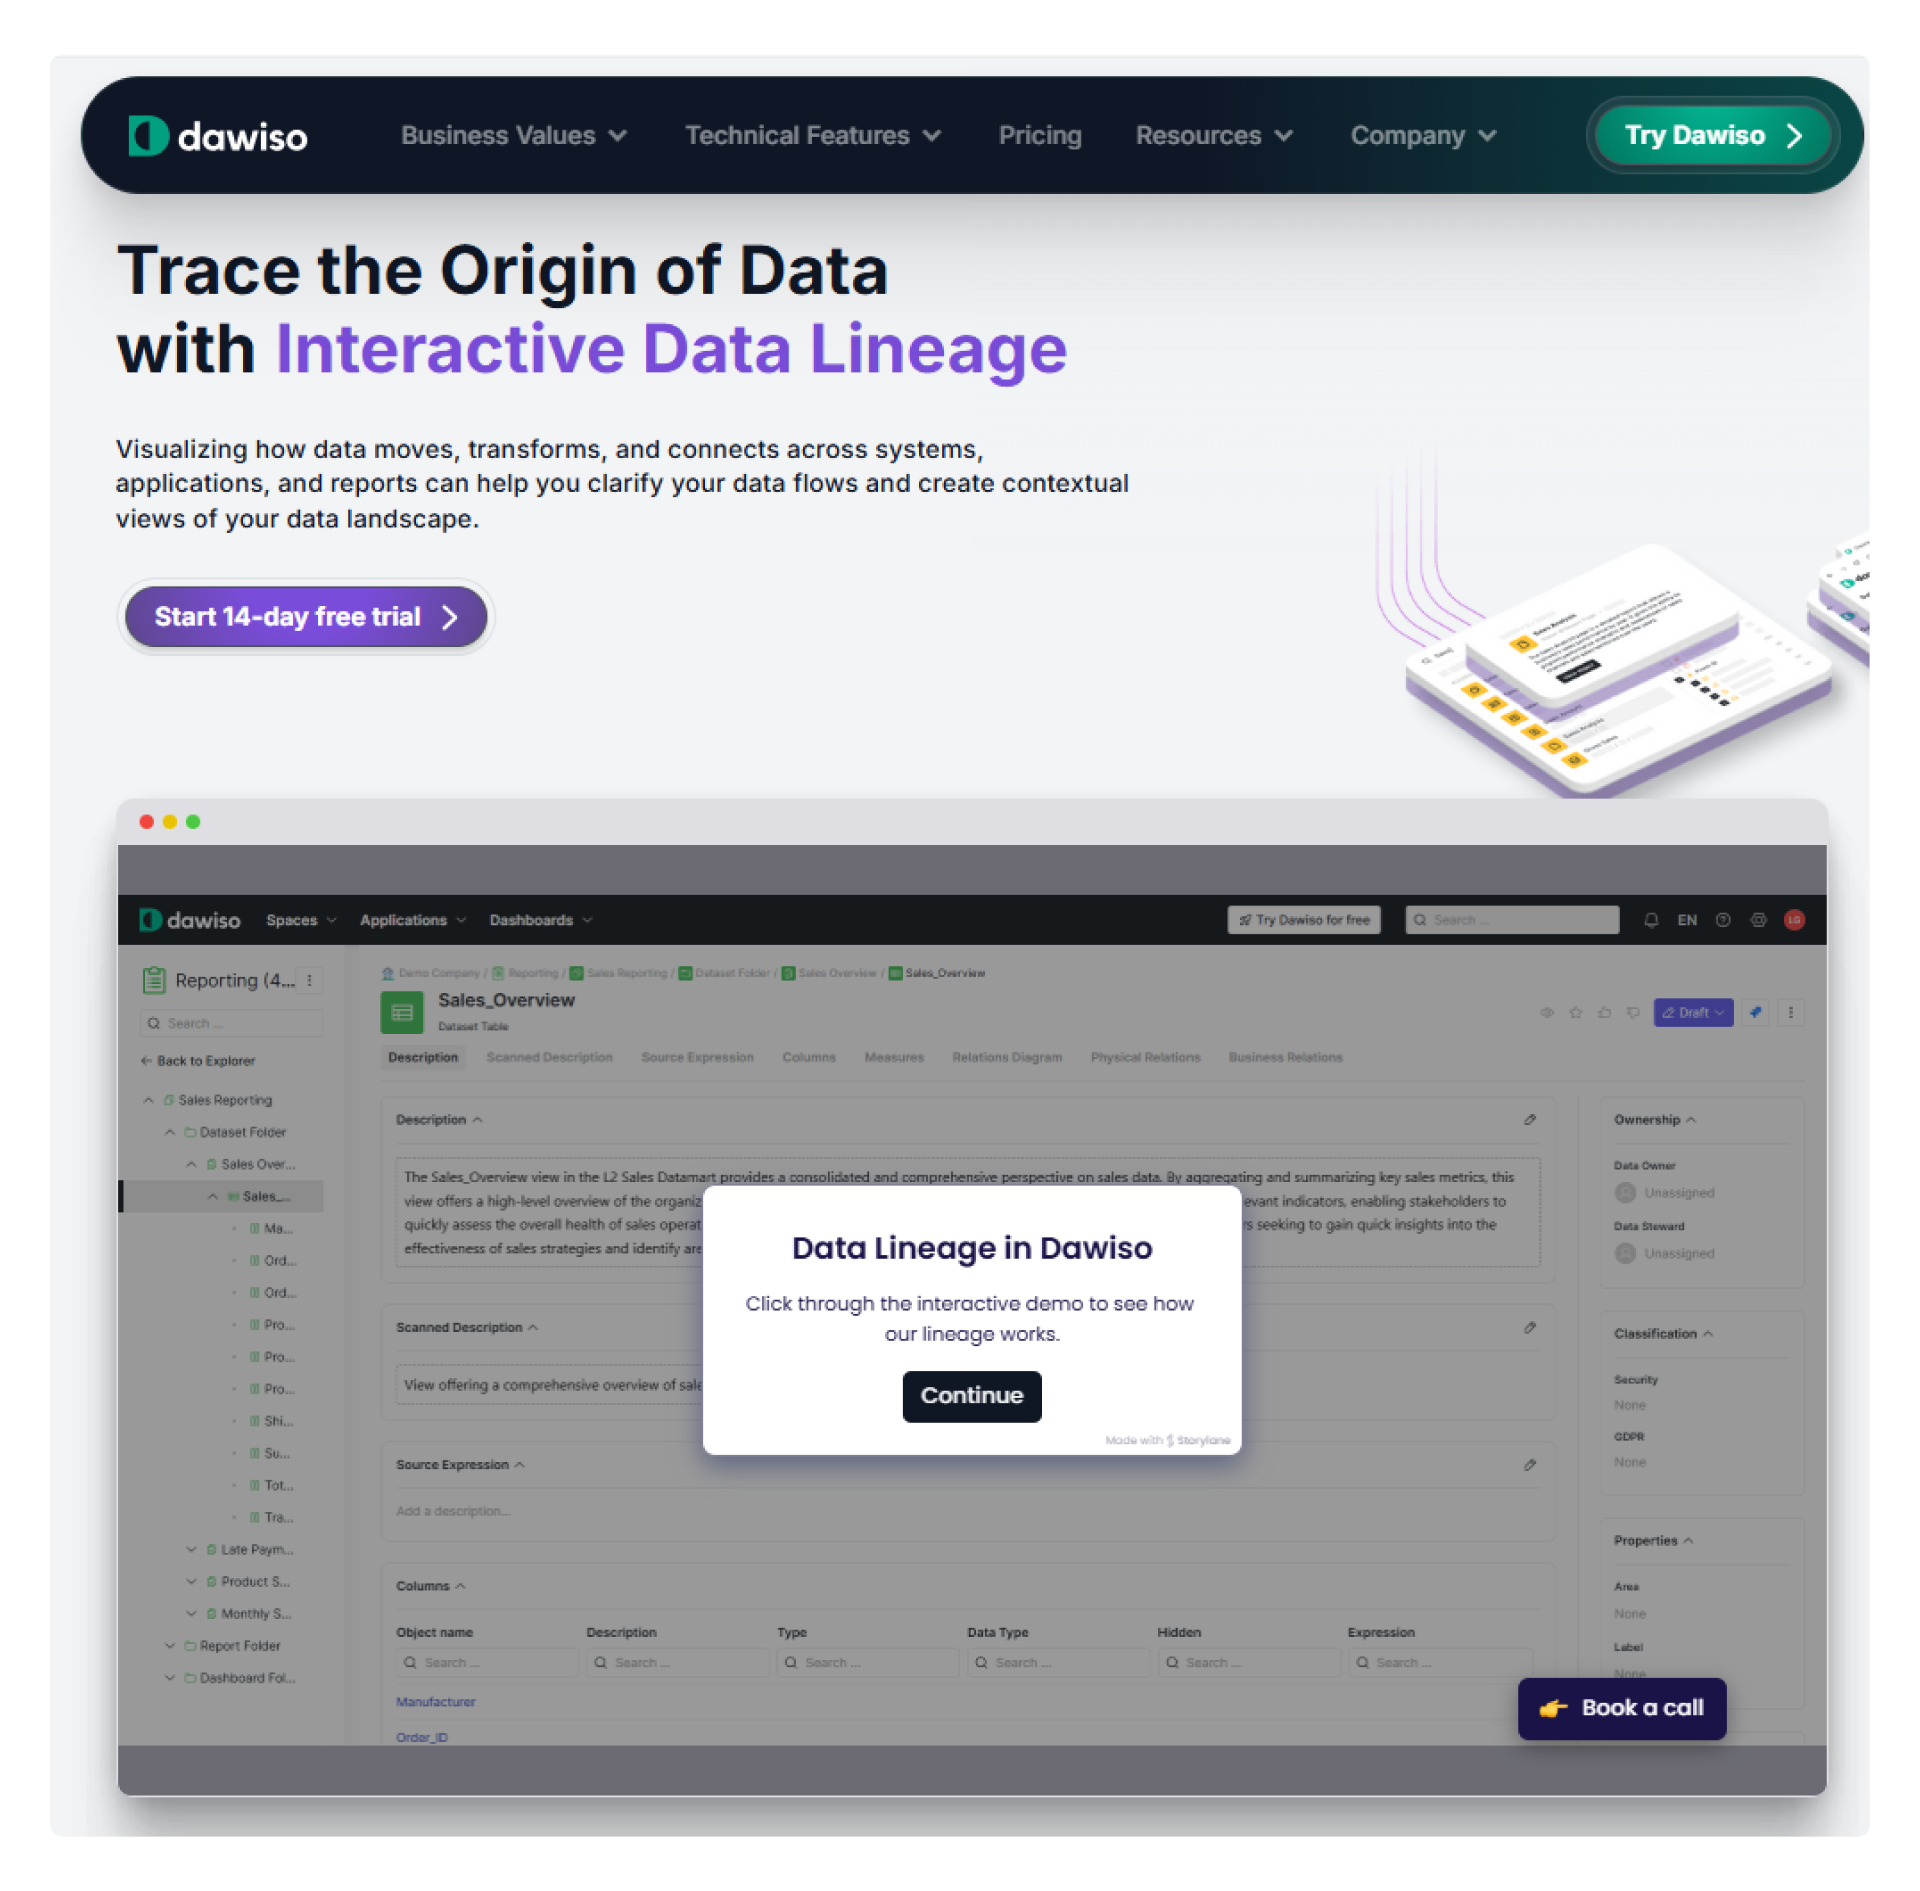
Want to see what that actually looks like?
Click through our interactive demo to explore how data lineage works. Step by step, without needing to sign up. It’s the easiest way to understand how it can help your team save time, reduce risk, and make better decisions.
You can also read this article which explains the data lineage in simple terms.